
← Back To Blog
What Is Performance Reporting for Upwork Freelancers
Performance reporting is the structured practice of measuring actual results against goals and communicating what happened, why, and what to do next. A useful report usually centers on 4–7 primary KPIs, rather than a long list of disconnected activity counts.
You may already be doing the first half without realizing it. You send proposals, check for replies, answer messages, attend calls, and notice whether contracts arrive. Then a quiet week appears, and you start guessing. Was the niche wrong? Did your rate scare people away? Did your profile need new samples? Without a reporting habit, every explanation feels possible and none is testable.
For an Upwork freelancer, performance reporting turns that uncertainty into a manageable funnel. You can see where opportunities slow down, compare results with targets, and attach a practical action to the weakest stage. The same logic works for an agency managing several bidders, especially when everyone uses the same KPI definitions and reporting periods.
Why Tracking Proposals Without Reporting Gets You Stuck
A freelance web designer sends proposals throughout the week. Some are carefully personalized, others are written quickly between client calls. A few clients reply, one schedules a conversation, and no contract follows. The next week stays quiet. She changes her headline, lowers her rate, and applies to a different niche, but none of those decisions comes from evidence.
That cycle is common on Upwork because the platform exposes activity more readily than it explains performance. You can count proposals and observe replies, but counting alone doesn't tell you whether the message, timing, targeting, profile, or sales conversation caused the outcome.
Practical rule: A number becomes useful only when it changes a decision.
That is the difference between tracking and reporting. Tracking records that a proposal was sent. Performance reporting compares actual results with a goal, explains the likely cause of a variance, and identifies the next action. Manitoba government guidance describes the discipline as a framework linking planning documents with annual reporting to clarify goals, communicate priorities, monitor progress, support continuous improvement, and inform budgeting and resource allocation decisions. The guidance also positions reporting as information for legislators, the public, media, and other stakeholders, not merely an internal activity log. Manitoba's performance reporting guide provides that broader accountability context.
For a freelancer, the stakeholders may be simpler. You are reporting to yourself, a business partner, or an agency owner. The questions remain the same:
- What happened: Did proposals earn replies, calls, and contracts?
- Why did it happen: Which stage moved differently from the target?
- What happens next: What will you change, who will do it, and when will you review it?
A good report might reveal that proposals are receiving replies but conversations rarely become calls. That points toward qualification or messaging, not necessarily more applications. It might show that calls happen regularly but contracts take too long to close, which suggests a problem with follow-up, offer clarity, or project fit.
The rest of the process follows that funnel from proposal to reply, call, and win. You'll see which metrics deserve attention, how to read a dashboard without drowning in data, and where a tool such as Earlybird AI can automate collection and connect measurements to operational action.
Understanding the Core Concept of Performance Reporting
A fitness tracker tells you that you walked, slept, or exercised. A coach's report asks a more useful question: did that activity move you toward the result you wanted, and what should you change next?
Performance reporting works the same way. An Upwork activity log might show proposals sent, messages answered, and calls attended. A performance report places those observations beside goals and interpretation, so you can manage the pipeline instead of merely describing it.
The five parts of a useful report
Start with actual performance, the result recorded for the reporting period. Then add the target, the result you intended to reach. The difference between them is the variance, which tells you how far performance sits above or below plan.
You also need trend direction, because one period can mislead you. A reply rate that falls in one week may be noise, while a sustained decline deserves investigation. Finally, show progress toward the goal, so the reader can tell whether the current path is likely to reach the intended outcome.
These elements answer different questions:
- Actual: What did the funnel produce?
- Target: What did you plan to produce?
- Variance: Where did reality differ from the plan?
- Trend: Is the movement improving, declining, or staying stable?
- Progress: Are you moving toward the objective?
A metric is any measurement derived from data. A KPI, or key performance indicator, is the smaller subset connected directly to a business goal. Proposal count may be a metric. Reply rate becomes a KPI when your goal is to create qualified conversations through better targeting and messaging. FanRuan's guide to performance reporting and KPI structure separates these concepts and identifies actuals, targets, variance, trend, and progress as distinct report elements.
From annual narrative to continuous control
Large institutions once treated performance reporting mainly as an annual narrative attached to a planning or financial cycle. Modern frameworks increasingly connect plans, measures, results, milestones, risks, benefits, and forecasts. The UK government's GovS 002 project delivery standard requires portfolio performance reporting to cover finances, benefits, costs, outcomes, milestones, and risks, while explaining variances and showing both achievement to date and forecasts.
That evolution matters because a report is no longer just a record of what already happened. It becomes a management system with baselines, comparisons, explanations, and forward-looking decisions.
Freelancers don't need a government-sized reporting process. They need the same underlying discipline in a smaller form. Your Upwork stats become useful when they show how a proposal moves through replies and calls toward a contract, and when each weak stage has a clear response.
The Key Metrics Every Upwork Performance Report Should Track
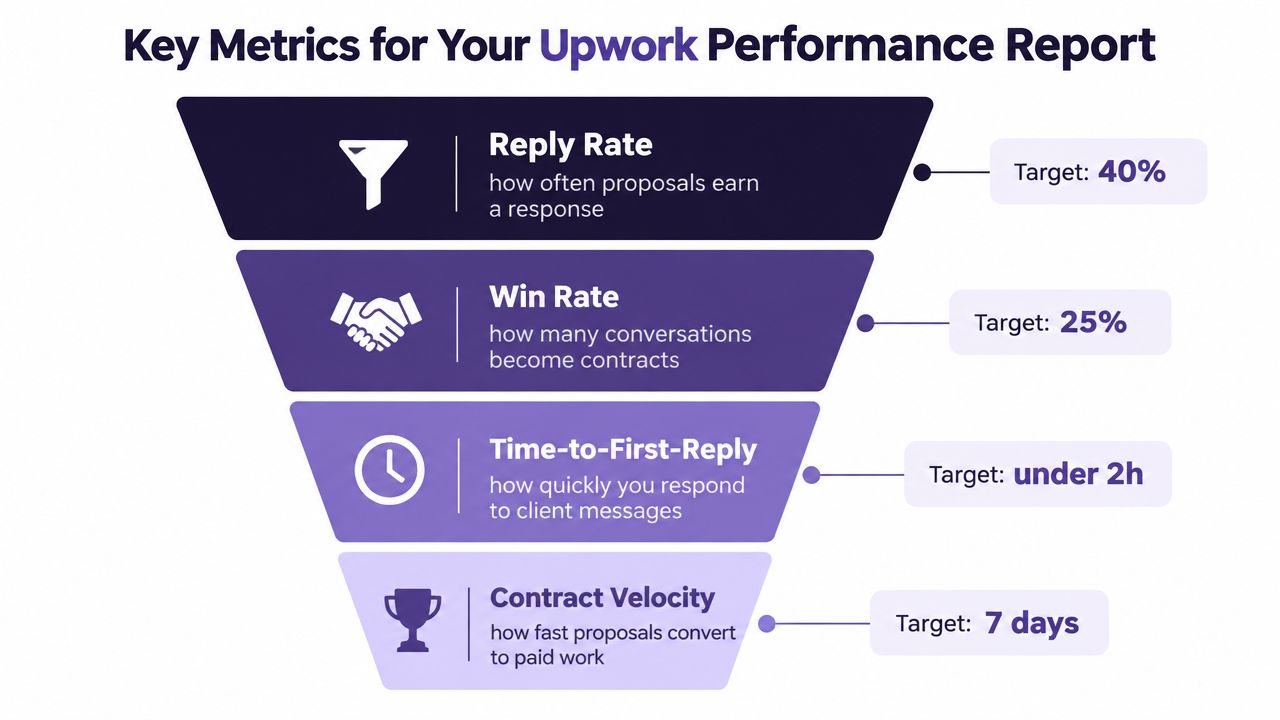
An Upwork funnel has a natural sequence: proposal, reply, call, win. The best report follows that sequence instead of treating every available number as equally important.
Keep the executive view to 4–7 primary KPIs tied directly to strategic objectives, as recommended in ClearPoint Strategy's guide to executive performance reporting. Each KPI should show the current result against target, the direction of movement, and an on-track, at-risk, or off-track status.
Reply rate
Reply rate measures how often proposals earn a response. It helps you evaluate targeting, opening lines, relevance, and the clarity of your offer.
A weak reply rate can reflect poor job selection or generic proposals. A strong reply rate doesn't guarantee revenue. If many clients respond but few agree to a call, your first message may be doing its job while the conversation strategy fails to qualify or persuade.
Win rate
Win rate measures how many qualified conversations become contracts. It sits later in the funnel, so it can reveal a different problem from reply rate.
A high reply rate paired with a low win rate usually points away from application volume. Review the questions you ask, how you frame outcomes, whether your samples match the brief, and how clearly you define the next step. If both rates are weak, improving targeting and proposal relevance may deserve attention before sales-call changes.
Time to first reply
Time-to-first-reply measures how quickly you respond to a client message. Speed shapes the client's first impression because a prompt, relevant answer signals attention and availability, while a delayed response can allow the conversation to cool.
Don't read speed in isolation. Fast replies that lack useful answers may create activity without progress. Pair this KPI with reply quality, call bookings, or win rate so the report distinguishes responsiveness from meaningful movement.
Project velocity
Project velocity, or contract velocity, measures how quickly work moves from opportunity to paid engagement and then through delivery. It connects the top of the funnel with the operational capacity required to fulfill the work.
A freelancer can win consistently and still experience weak velocity if proposals sit unanswered, calls are scheduled too late, onboarding drags, or delivery milestones slip. Define the start and end points consistently. Otherwise, one person may measure from proposal to contract while another measures from kickoff to delivery.
For a practical reference on selecting and interpreting operational measures, review this guide to project tracking metrics. It helps place funnel indicators alongside timing, throughput, quality, and delivery signals.
A metric only earns KPI status when it supports a decision. If your goal is more qualified Upwork calls, reply rate and time-to-first-reply may matter more than total applications. If your agency needs faster revenue realization, win rate and contract velocity may deserve priority. For related acquisition measures, see client engagement metrics for Upwork.
How to Interpret Dashboards and Trends Without Drowning in Data
A dashboard isn't a report just because it contains charts. It becomes decision support when a reader can identify a meaningful change, understand its likely cause, and assign a response.
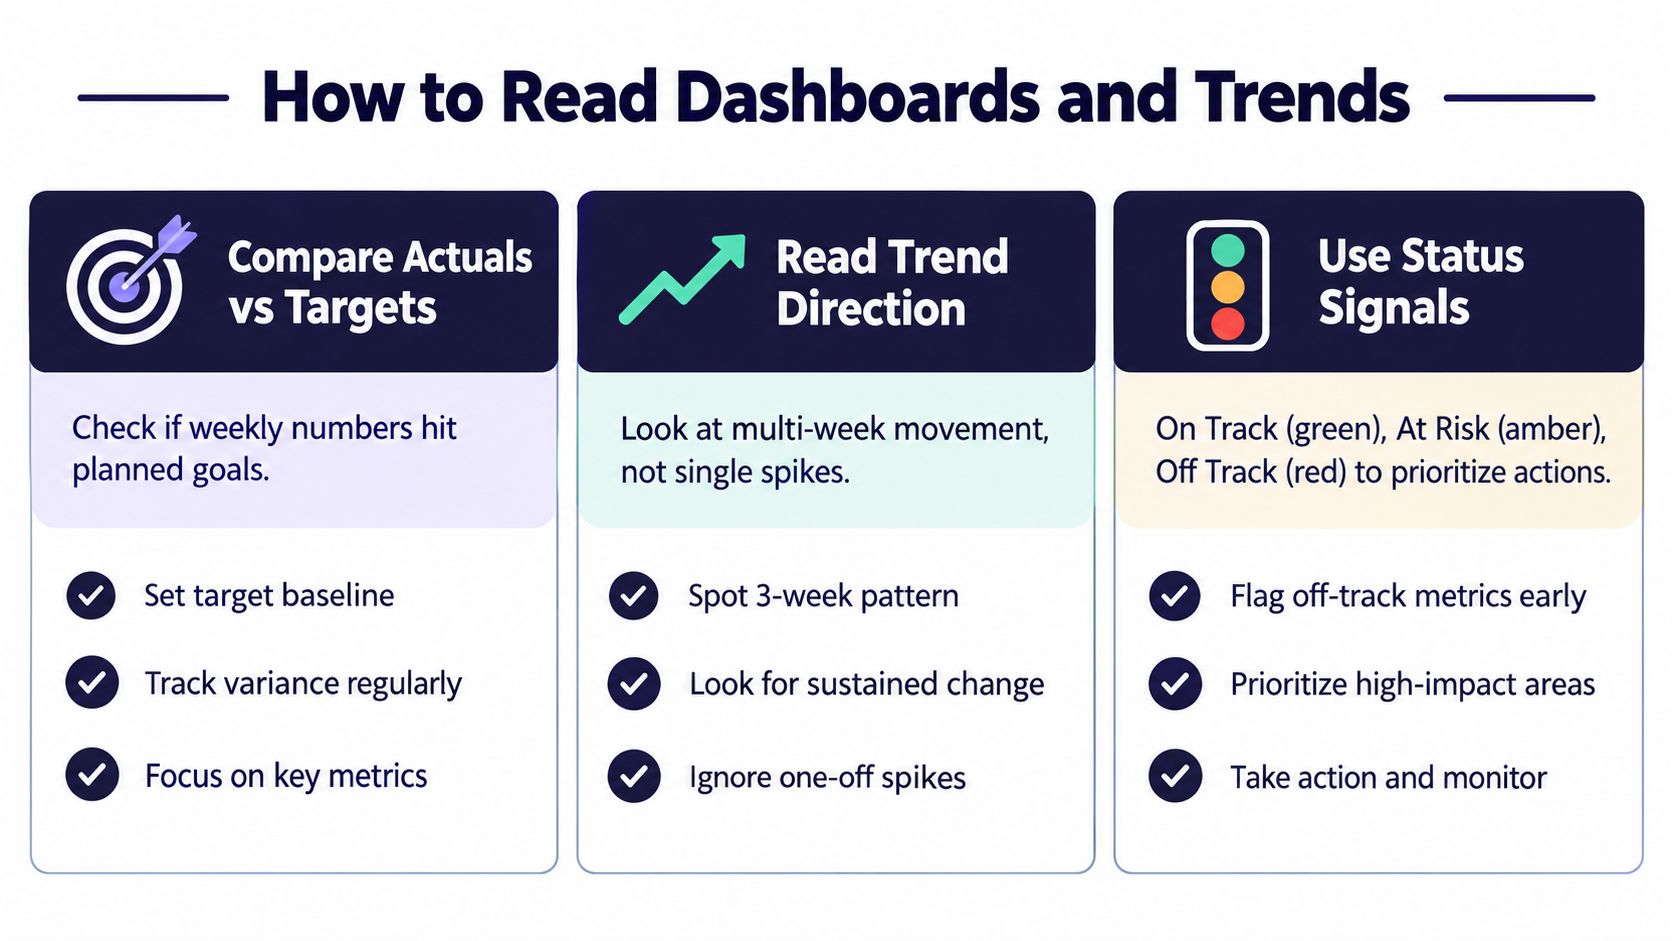
Begin with actual versus target. Suppose your target is to generate a certain number of qualified calls from proposals during the reporting period. The actual result tells you what occurred, the variance shows the gap, and the commentary explains whether targeting, messaging, speed, or follow-up most likely caused it.
Read the movement, not the snapshot
Next, examine trend direction. A single strong week can result from an unusually good project mix, while one weak week may reflect holidays, client demand, or a small sample. Look for a pattern across multiple reporting periods before changing your niche, rates, or profile.
Use simple status signals:
- On track: Keep the current approach and monitor it.
- At risk: Identify the emerging cause and test a correction.
- Off track: Assign an owner, recovery action, and review date.
Exception-based reading keeps the dashboard manageable. Spend only brief attention on green items. Give yellow and red items the detail they deserve, including the cause, corrective action, owner, and date. That structure turns a color into accountability.
A red KPI is not a verdict on your business. It is a prompt to investigate one part of the system.
Match the cadence to the decision
Use short weekly check-ins for immediate operating choices, such as proposal quality, reply speed, and follow-up. Monthly reviews can examine broader patterns, profile tests, conversion movement, and capacity. OKR-based reporting often uses quarterly cycles lasting about 90 days, with weekly check-ins keeping progress visible between formal reviews, as described by What Matters' OKR timeframe guide.
A same-day dashboard check can follow this sequence:
- Compare actuals: Put each primary KPI beside its target.
- Mark variance: Note the largest favorable and unfavorable gaps.
- Check direction: Look for sustained movement rather than a single spike.
- Find the stage: Identify whether the issue sits at proposal, reply, call, or win.
- Write the cause: Record the most plausible explanation.
- Choose an action: Change one controllable input.
- Assign ownership: Name the person responsible.
- Set a date: Decide when you'll review the result.
For teams designing live views for multiple stakeholders, Refport's real-time dashboard design guide for partner programs offers useful context on keeping dashboards focused on timely, role-relevant signals.
Performance Reporting Examples for Freelancers and Agencies
A report becomes easier to understand when you can see the decision hiding inside it. The following examples use invented working scenarios, not claims about actual companies, so the point is the structure rather than a promised outcome.
A solo designer finds the bottleneck
A freelance web designer tracks proposals and conversations each week. Her report records actual reply rate, target reply rate, variance, trend, and status. It also records win rate, because replies alone don't pay the bills.
The first report shows that replies are arriving, but contracts remain inconsistent. She reviews message timestamps and notices that her fastest replies tend to lead to better conversations. The report doesn't prove that speed alone caused every win, but it gives her a testable hypothesis.
Her commentary might read:
“Reply activity is healthy, but conversion from conversation to contract is below target. Conversations started after delayed responses appear less engaged. For the next reporting period, reserve a response block during the posting windows that produce the most relevant jobs and compare call bookings with the prior pattern.”
The next action is specific. She changes her schedule, keeps the proposal positioning stable, and watches time-to-first-reply, call bookings, and win rate. A data dump would have listed proposals and replies. This report supports a scheduling decision.
For more formats to adapt, see these performance dashboard examples. The useful feature isn't decorative design. It's the connection between the number, its interpretation, and the action.
A five-person agency standardizes the view
A small agency manages several Upwork bidders. One freelancer counts a win when a client signs, another counts it when a call is booked, and a third reports only completed projects. Their dashboard appears busy, but the team can't compare performance fairly.
The agency creates a shared definition for proposal, reply, call, win, and velocity. Each account uses the same reporting period and records actual result, target, variance, trend, status, commentary, and next action.
At the review, one bidder shows stronger reply performance but weaker call conversion. Another generates fewer replies but more contracts. The owner reallocates proposal review time toward the first bidder's messaging and studies the second bidder's qualification and closing approach. The agency isn't ranking people from one number. It's locating different strengths at different funnel stages.
The report for each off-track KPI includes four practical fields:
- Cause: What may explain the variance?
- Action: What will change?
- Owner: Who will do it?
- Date: When will the team review the result?
That format keeps reporting from becoming a weekly ceremony. It makes the meeting about resource allocation, message testing, and follow-through.
How Earlybird AI Strengthens Your Performance Reporting
Manual reporting breaks when the data arrives from too many places. You copy proposal activity from one view, replies from another, call outcomes from messages, and contract details from a spreadsheet. By the time the report is ready, the numbers may use inconsistent definitions or cover different periods.
Earlybird AI can serve as one option for automating parts of this loop. Its Upwork workflow searches for suitable projects, creates personalized proposals, and replies to client messages automatically. Its stated operating timings are proposals submitted within about 10 minutes of a posting and replies delivered in under 5 minutes, which makes time-to-first-reply a measurable operating input rather than an occasional manual effort.
The reporting value comes from connecting that activity to outcomes. A dashboard can place proposal view rate, reply rate, interview rate, win rate, booked calls, and response timing in one view. Those measures still need agreed definitions and targets, but automatic collection reduces the risk that a freelancer forgets a proposal or records a reply late.
Use reports to test profile improvements
Profile optimization is another lever. If proposals earn attention but conversations don't progress, you can test stronger positioning, more relevant samples, or clearer proof of outcomes. The report won't decide which change is correct. It will show whether the change affects the later funnel stages.
Earlybird AI also provides multi-user workflows for agencies with several freelancers or bidders. That makes consistent KPI definitions and comparable reporting periods more practical. Members report double-digit reply rates and shorter sales cycles, which can serve as benchmarks to track, but those reports aren't universal guarantees and should be evaluated against your own account data.
The important distinction is between automation and judgment. Automation gathers and organizes signals. You still decide whether a weak win rate calls for better qualification, a profile experiment, a revised offer, or a different job mix. You can review the workflow at Earlybird AI and compare its reporting capabilities with the process you use today.
Turning Your First Report Into a Repeatable Habit
Your first report doesn't need to be elaborate. It needs to be consistent enough to reveal a pattern and concrete enough to trigger a decision.
Choose 4–7 KPIs that map to your current objective. For an Upwork freelancer, that may mean reply rate, win rate, time-to-first-reply, and contract velocity. Set a target for each, define exactly how you'll calculate it, and choose a weekly operating review plus a monthly pattern review.
Keep the operating loop small
Every red or off-track item should receive four pieces of commentary:
- Cause: What changed or may be creating the gap?
- Action: What specific input will you adjust?
- Owner: Who is accountable for the change?
- Date: When will you inspect the result?
Use a single source of truth for each data type. Standardized definitions prevent one reporting period from counting a reply differently from the next. Automated refreshes, validated data, formulas, targets, and threshold alerts reduce manual compilation and leave more time for anomaly detection and root-cause analysis. Monday's performance reporting guidance explains why authoritative data sources and consistent definitions matter for reliable reporting.
The same principle applies beyond Upwork. If you build reports across outreach channels, a resource on social media data reporting workflows can help you think through automated collection, repeatable formatting, and scheduled review.
A dashboard that nobody acts on is only a display. A short report that changes which jobs you target, when you reply, how you present your profile, or where your team spends proposal-review time is doing real operational work.
Within a 90-day cycle, consistent weekly observations can give you a much clearer view of which controllable lever influences your pipeline. You won't eliminate uncertainty, but you'll stop making major changes based on one quiet week.
Earlybird AI brings proposal search, personalized applications, automated replies, real-time analytics, profile optimization, and multi-user agency workflows into one Upwork sales process. Visit Earlybird AI to connect faster activity with the performance metrics and next actions that keep your pipeline moving.


